Reports
Sales, stock and till reports built from live data, ready to read on screen or download as CSV.
Because the shop, tills, warehouse and invoices all share one database, reports don’t need a data warehouse or a weekly spreadsheet merge. They’re worked out from the same records your team uses every day.
Sales
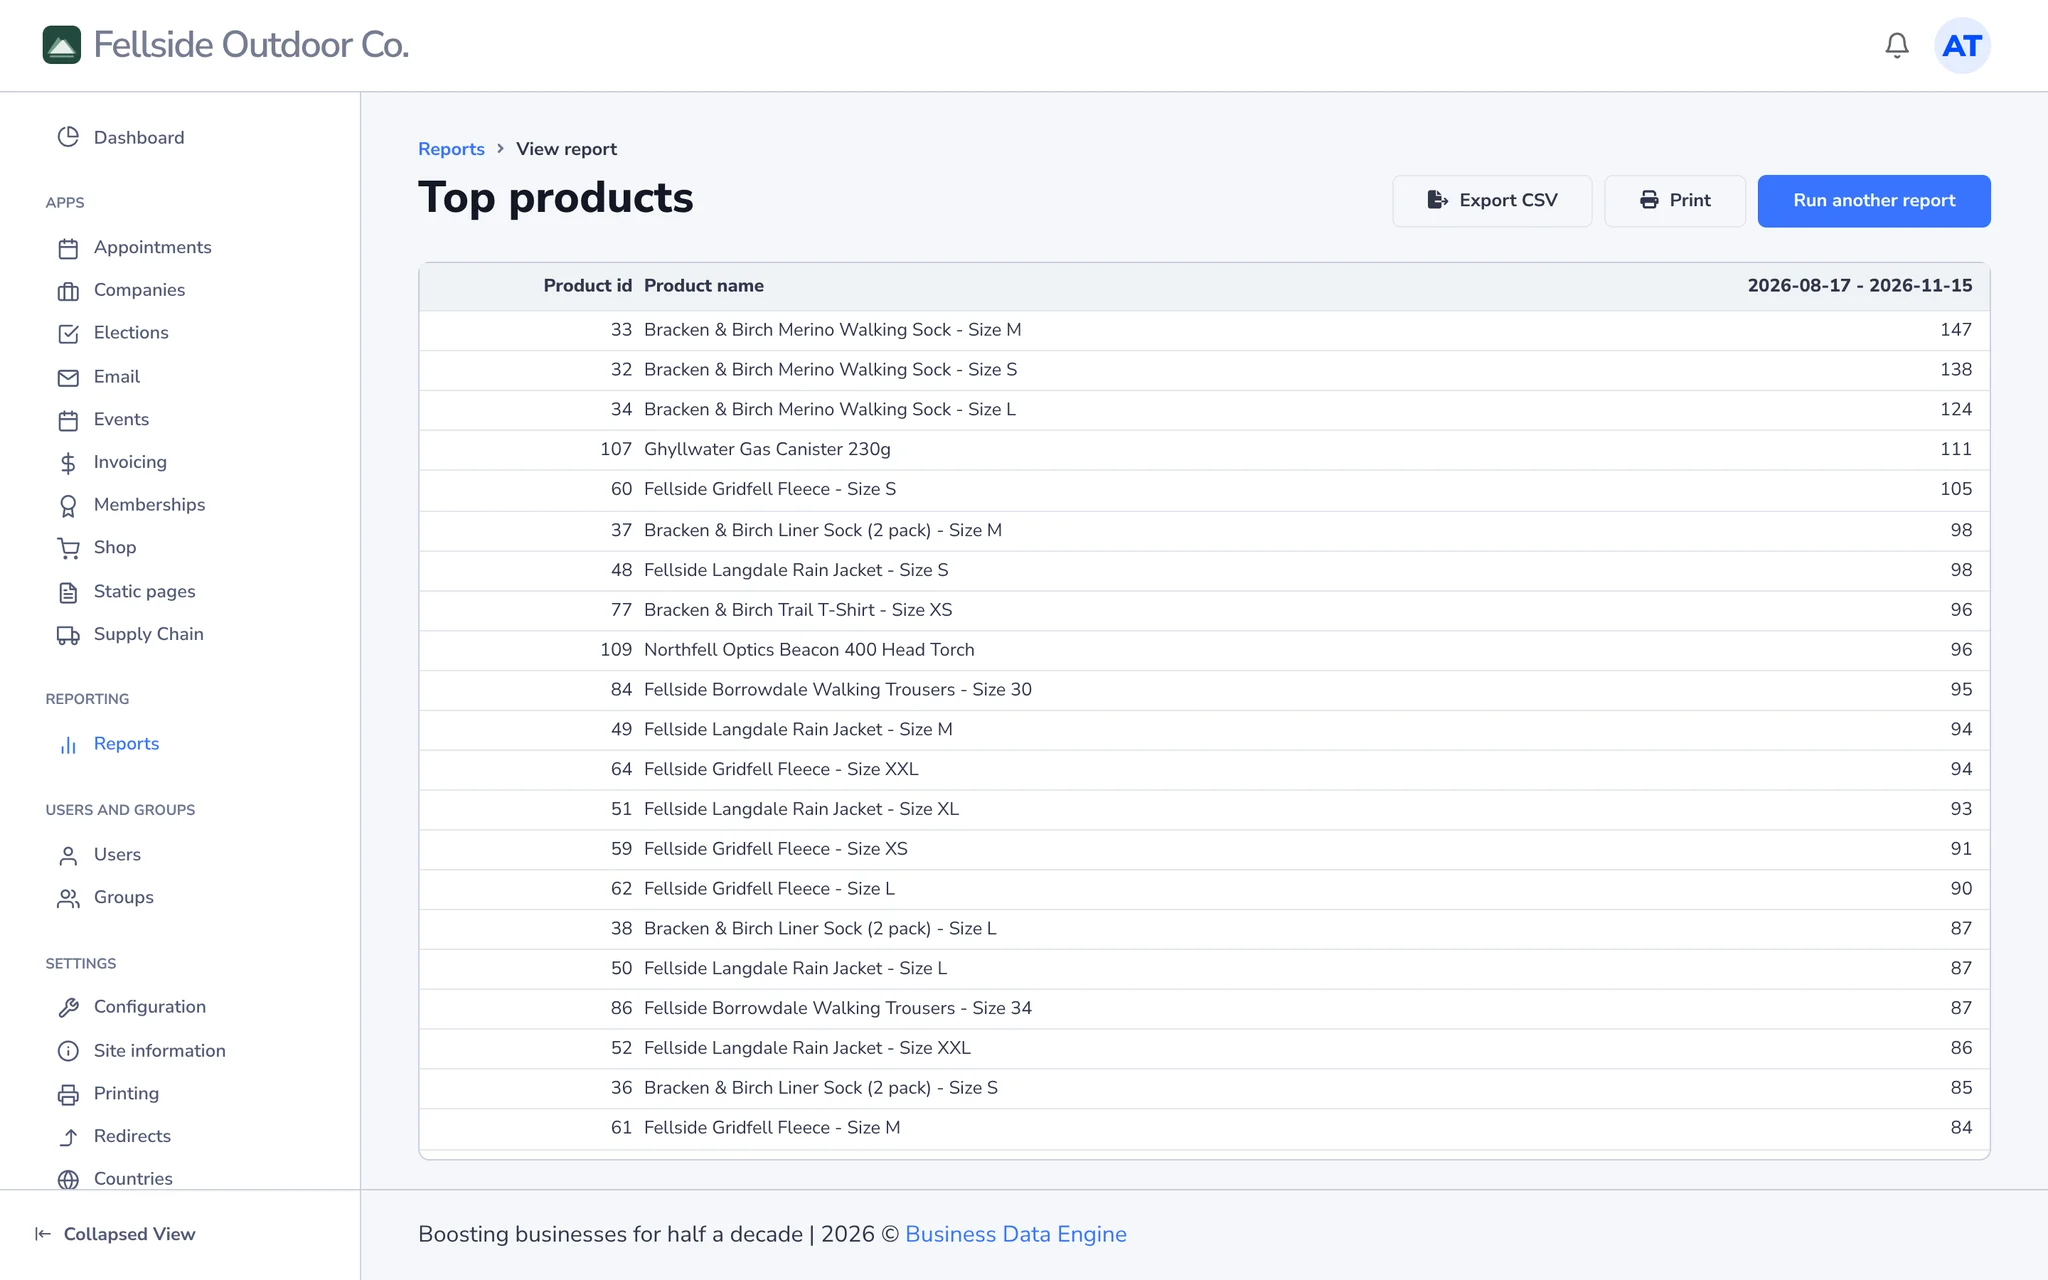
- Top brands and top products over any date range, compared with previous periods so you can see what’s growing and what’s slipping.
- Daily sales and sales for any date range.
- Till sales by location, as heatmaps of the number and value of sales by hour and day of the week.
Stock
- Out-of-stock report: which products will run out within a number of days, optionally for one brand.
- Stock value on any date, by FIFO or average cost.
- Warehouse stock, as an overall summary or bin by bin.
Run them when you like
Reports run in the background, so a big one never ties up your screen. Read the results in the admin console or download them as CSV for your spreadsheet or your accountant.
New reports are added as part of the platform, and modules bring their own, so the list grows with the system.
See it in action